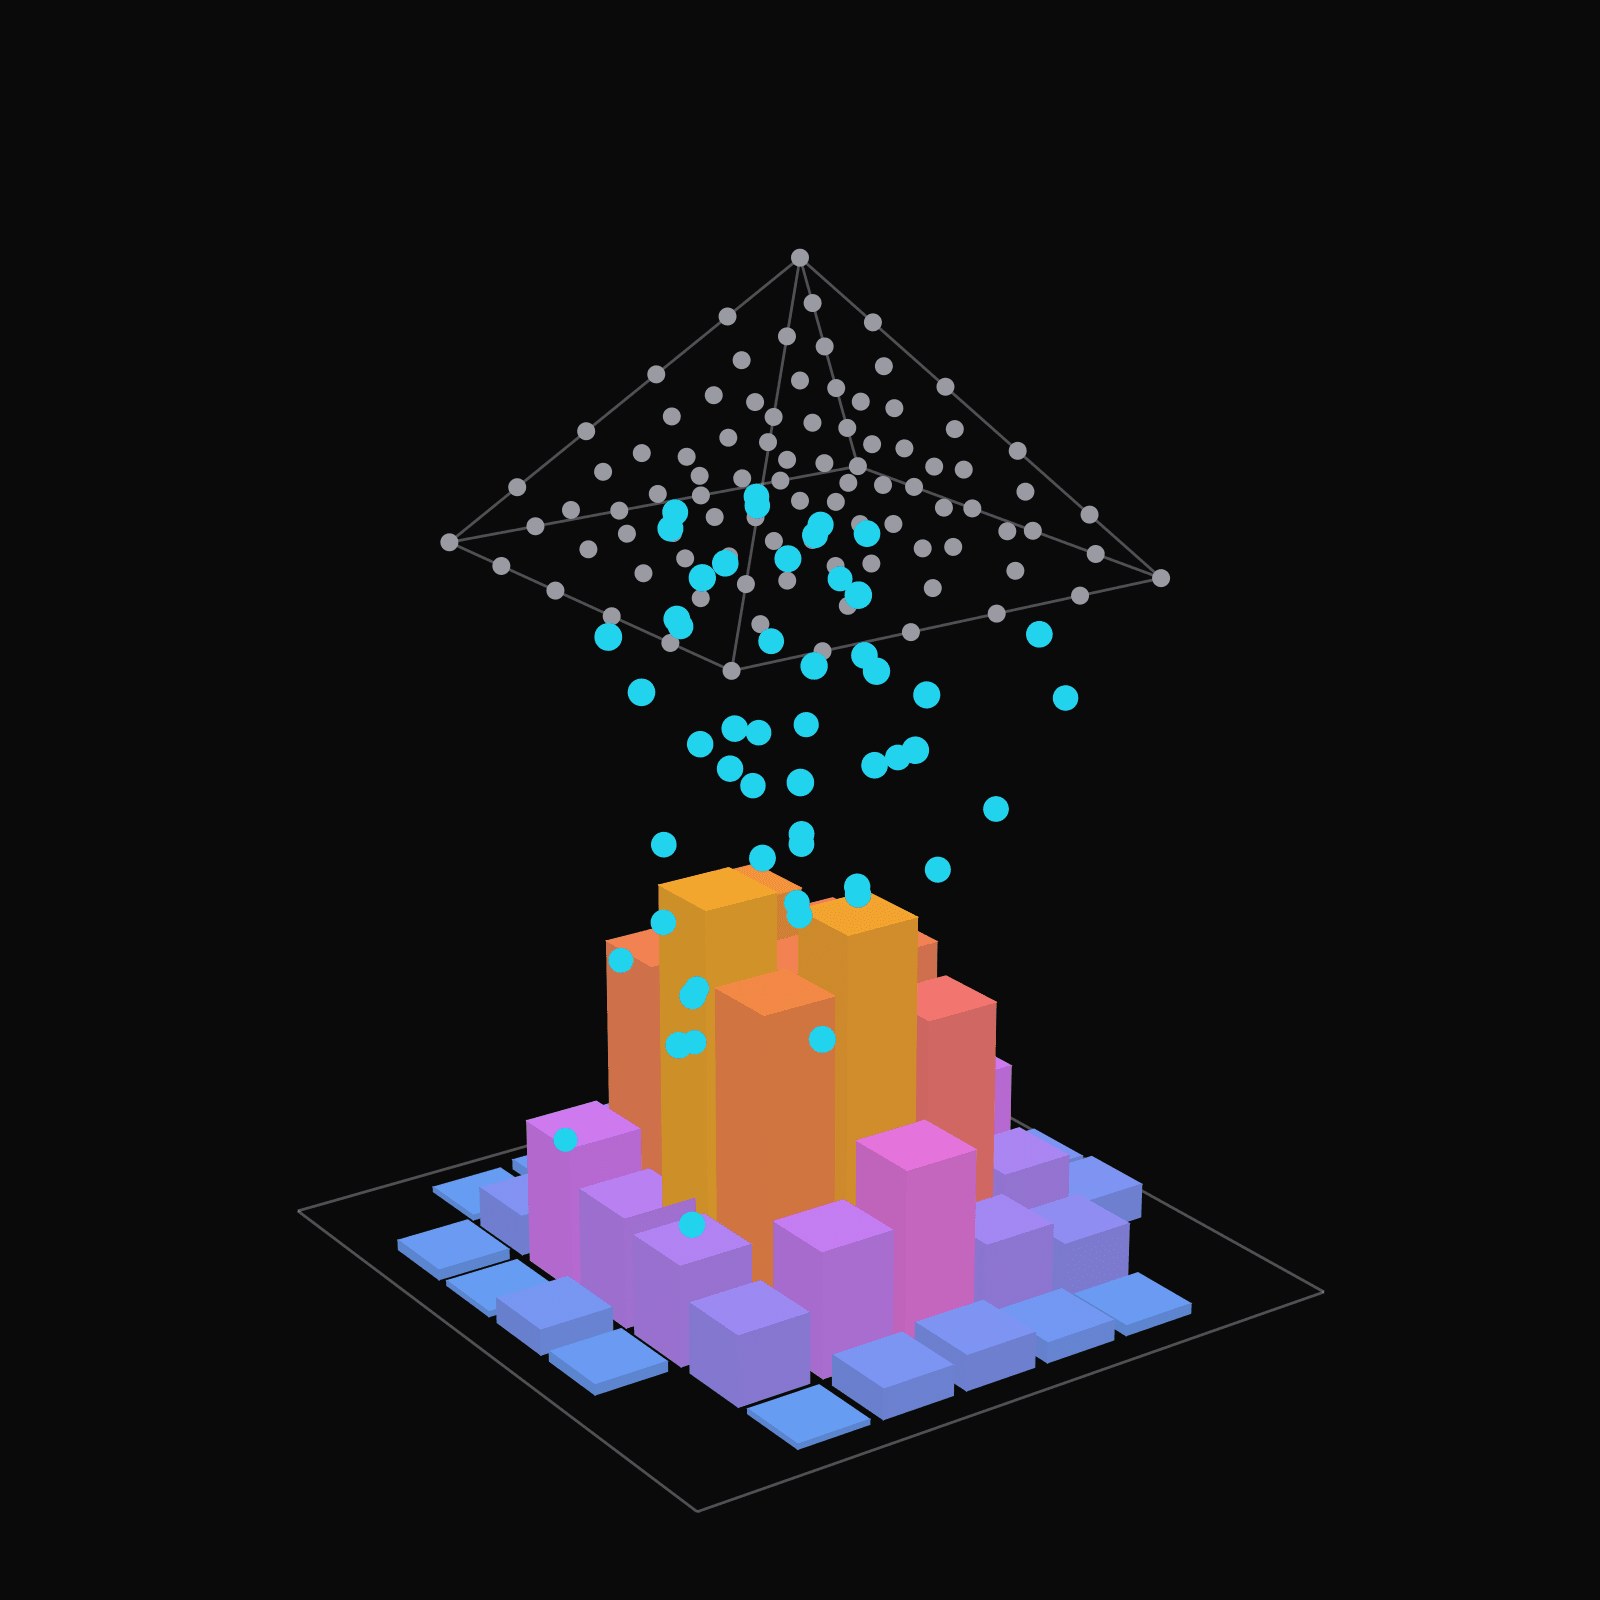
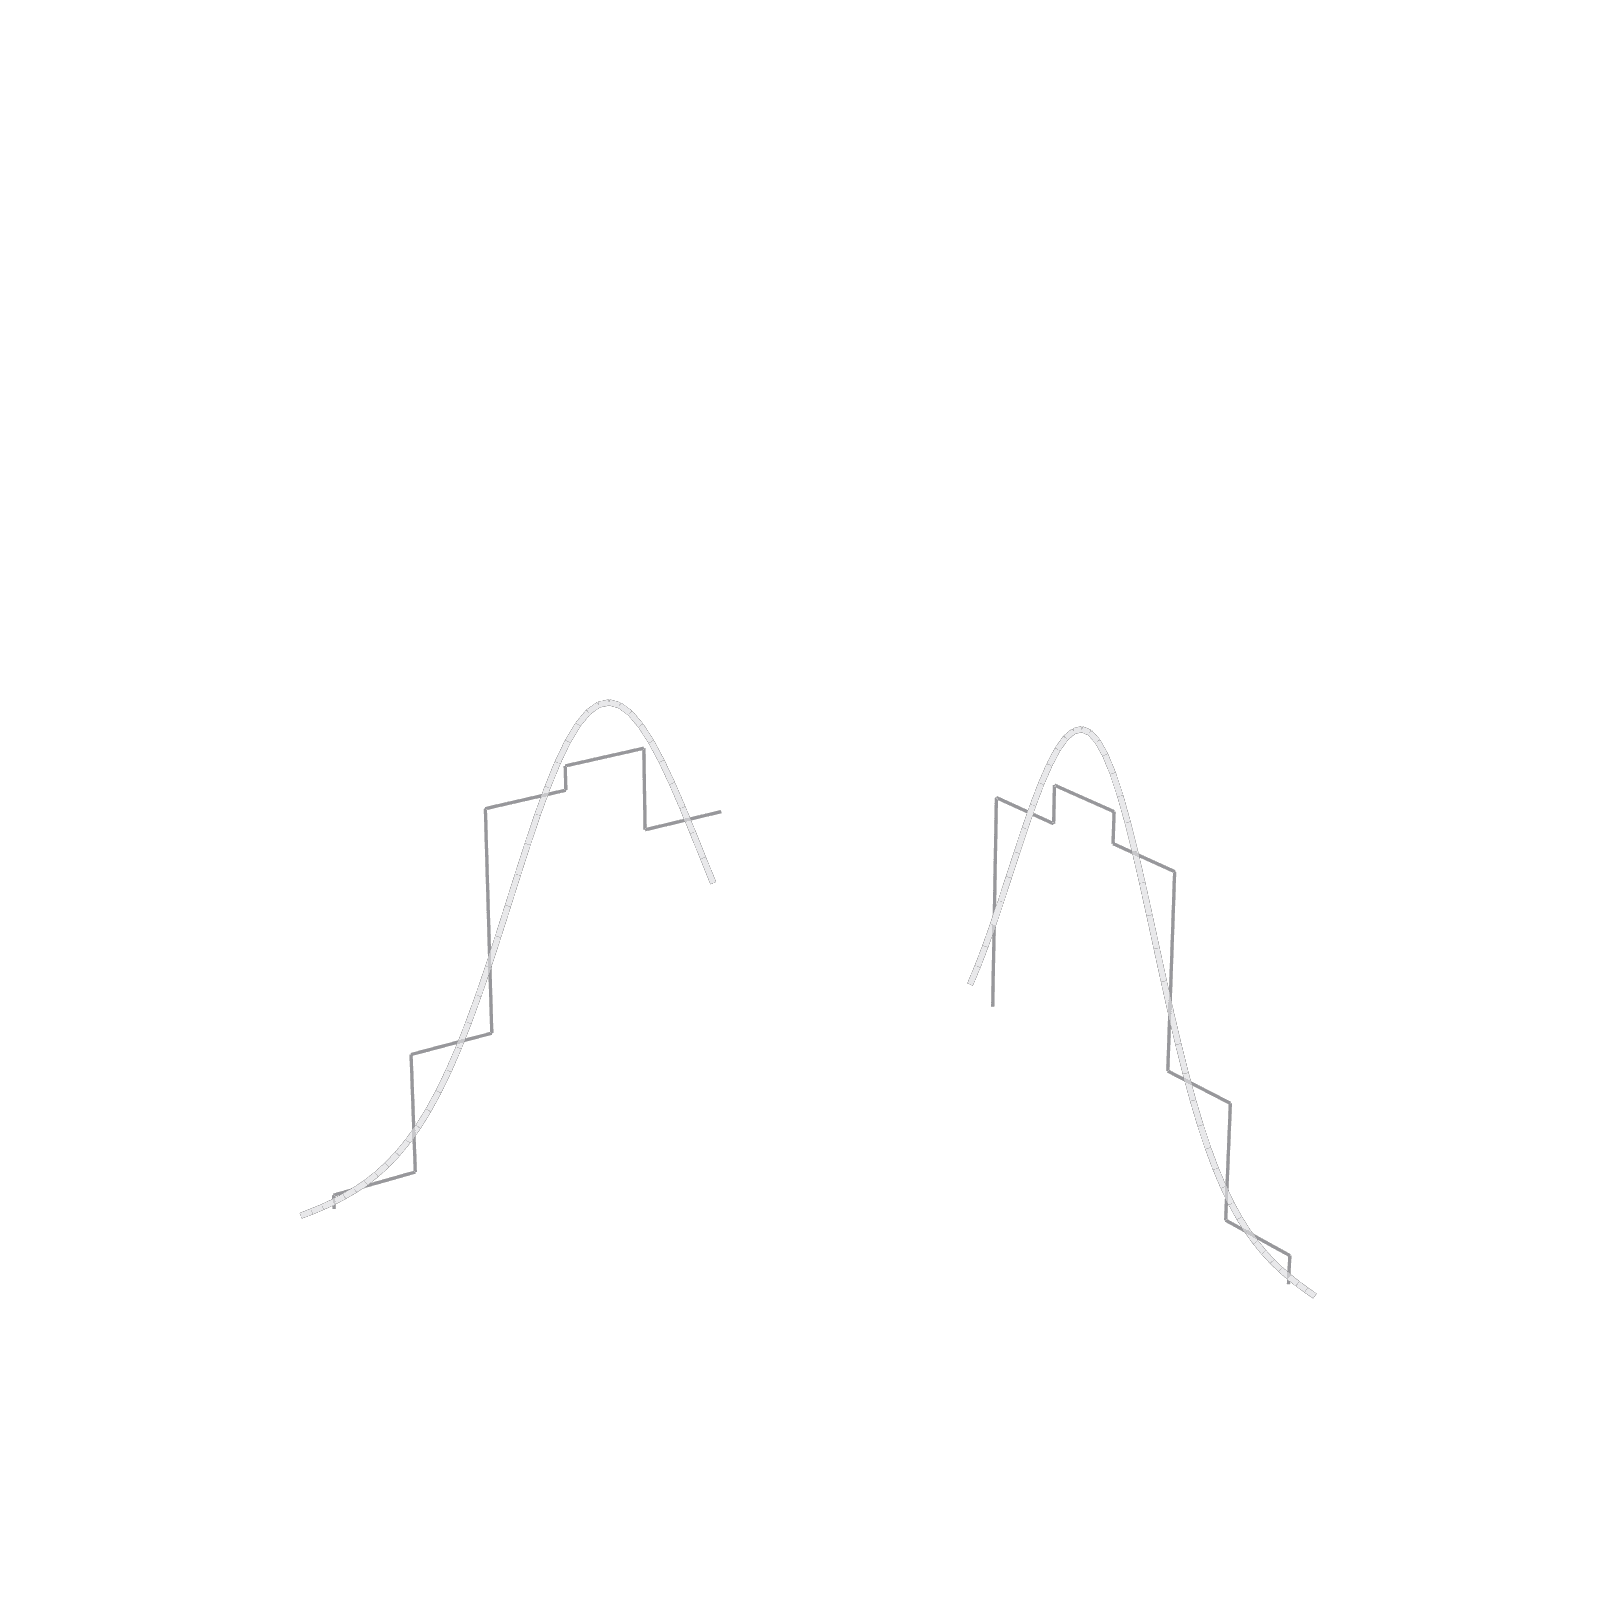
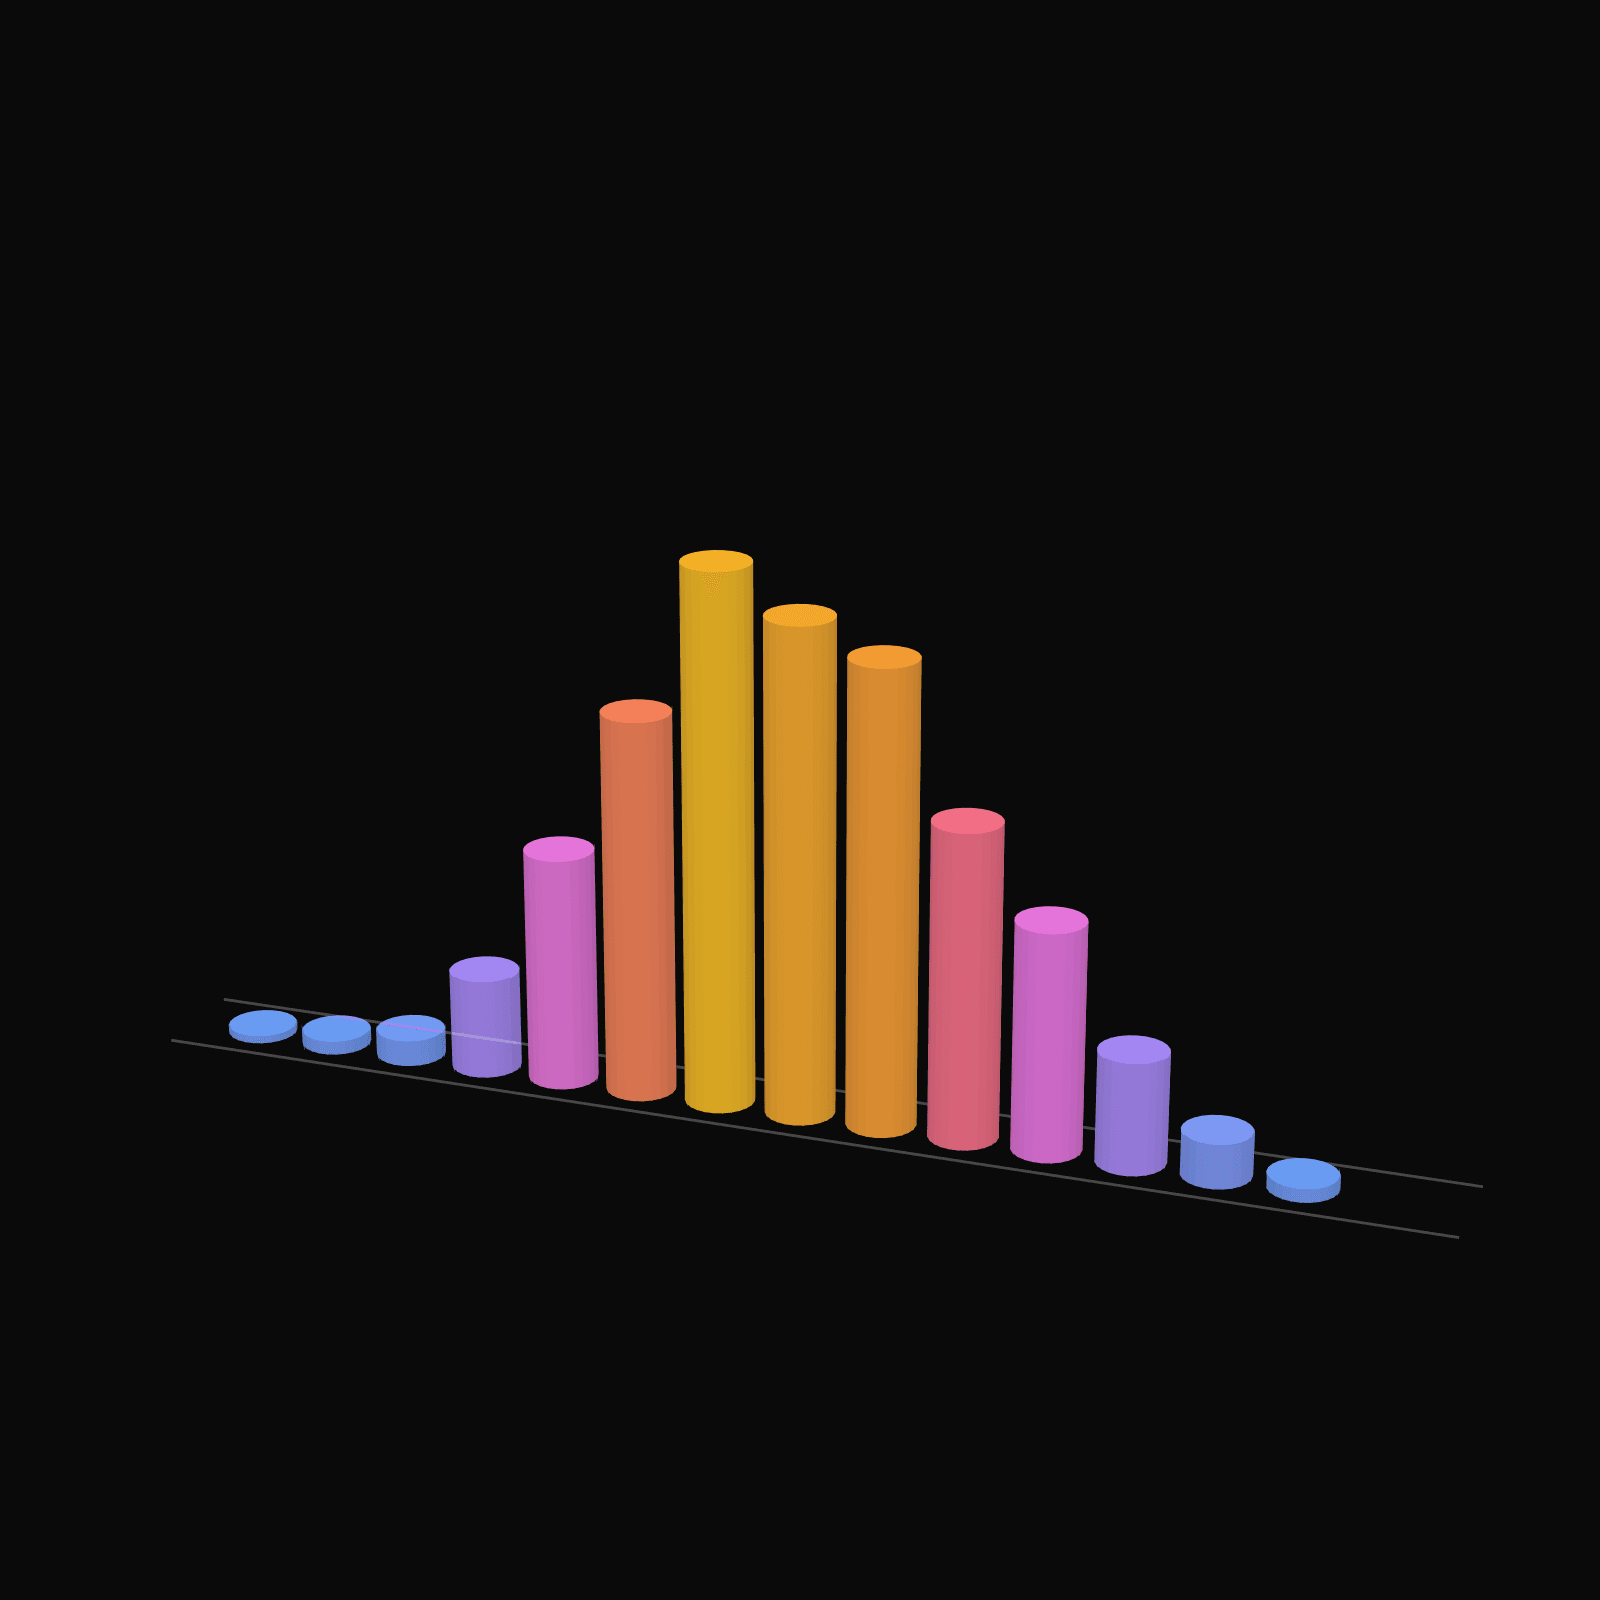
"""Normal from samples: five histograms, ten to a thousand draws, lined up in depth.

One histogram of normal samples shows a ragged shape; a row of them shows
the ragged shape settling as the sample grows. Each slice draws from the same
standard normal, with 10, 30, 100, 300 and 1000 samples from front to back,
and each is scaled as a density so the five are comparable at a glance. The
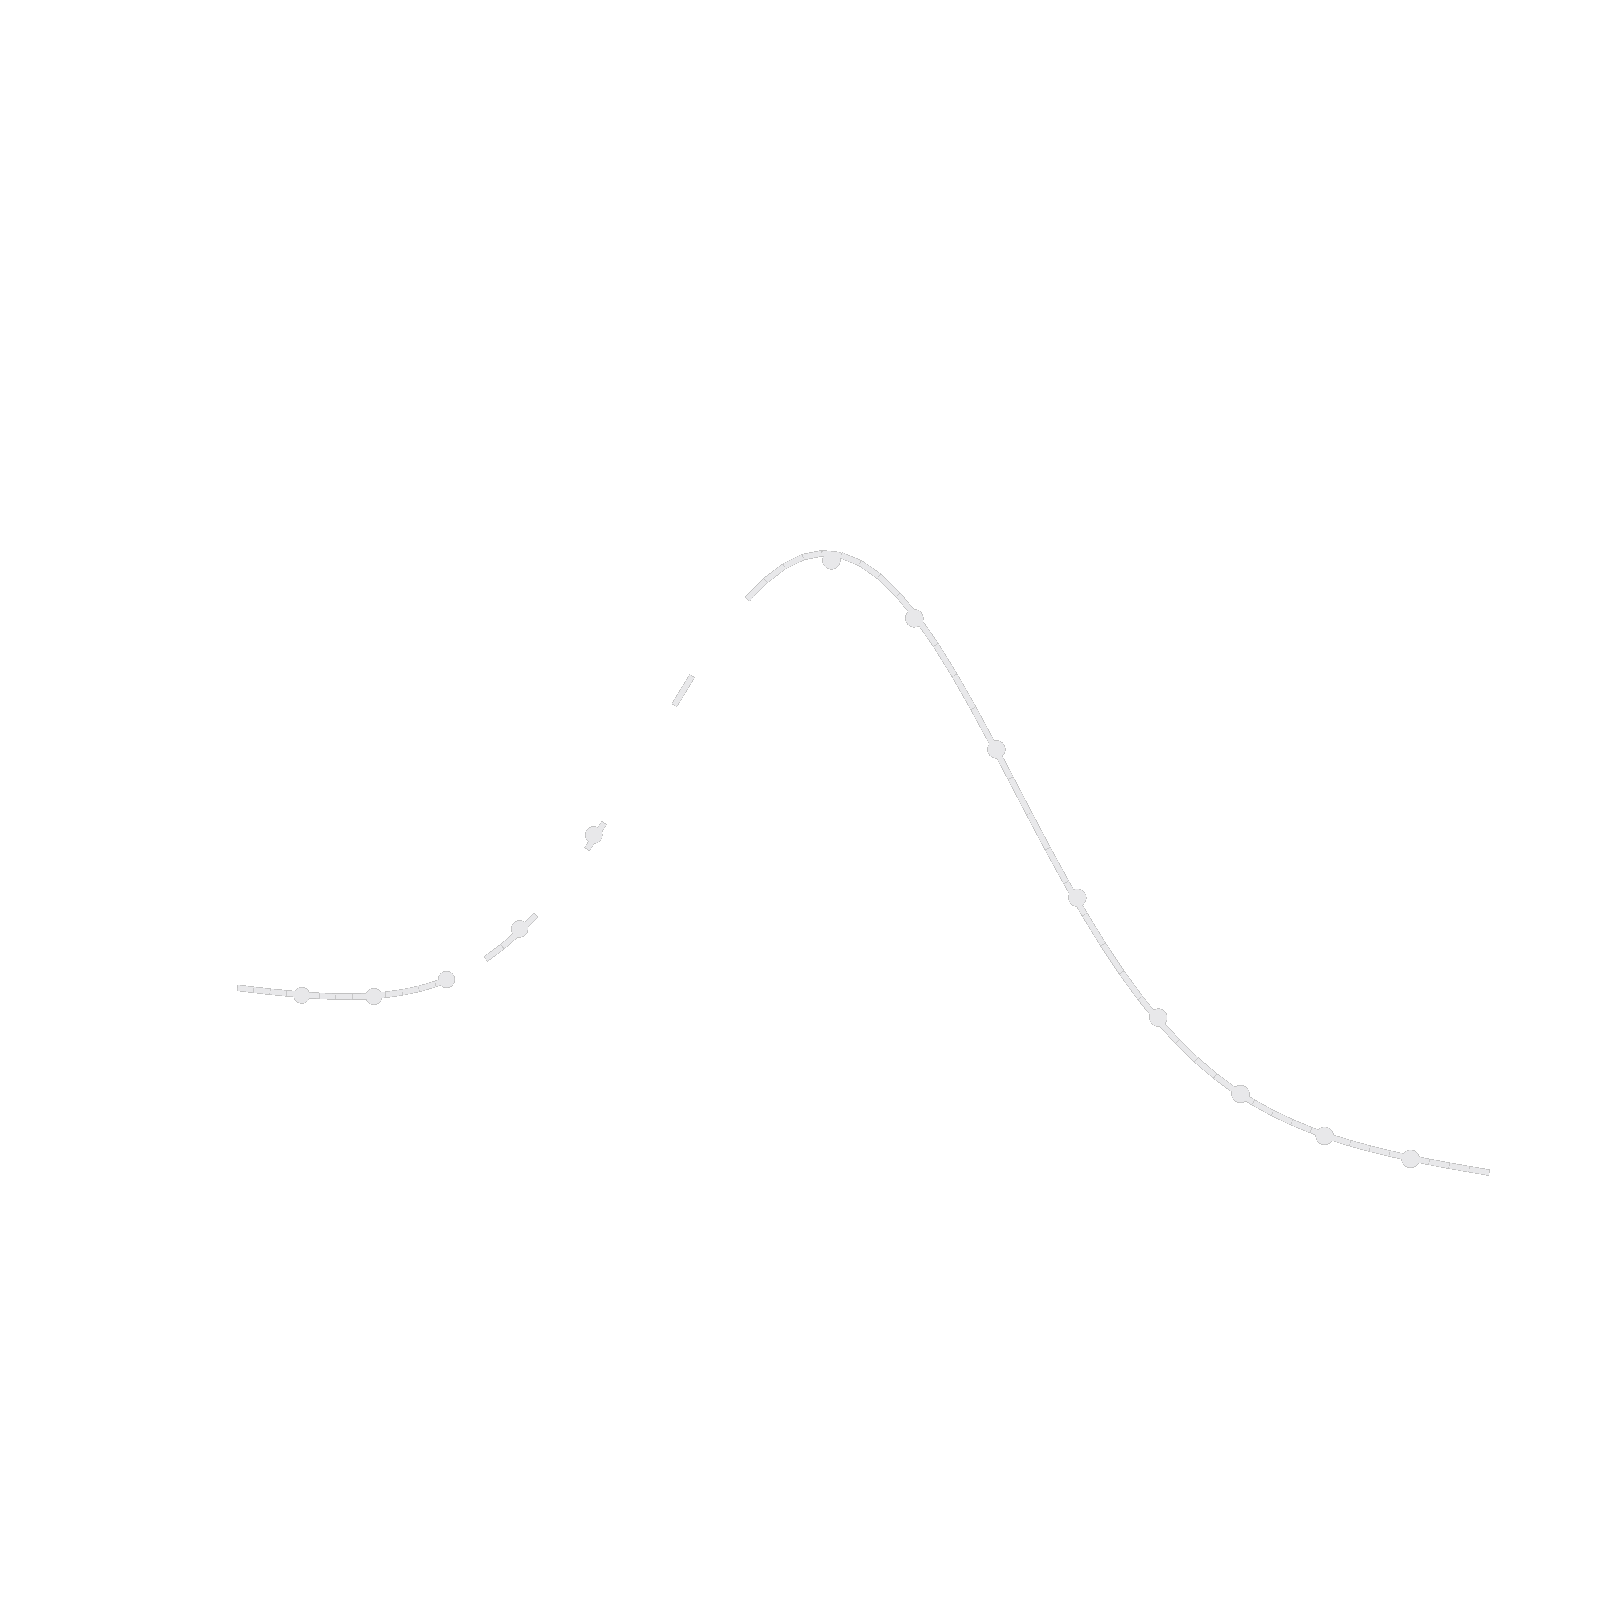
fit toggle lays over each slice the normal with that slice's own sample mean
and spread, which starts well off the truth at the front and closes on it
at the back.

The slices stand in a row that runs away from the default camera, looked at
from higher than the turntable's usual 20 degrees so the ones behind show
over the ones in front, the way a ridgeline plot staggers its rows.

Every sample is drawn from one seed up front, so the still is the loop's
last frame. The loop is a oneshot: the slices fill one after another, front
The full Manim source and the rendered video come with a plan.