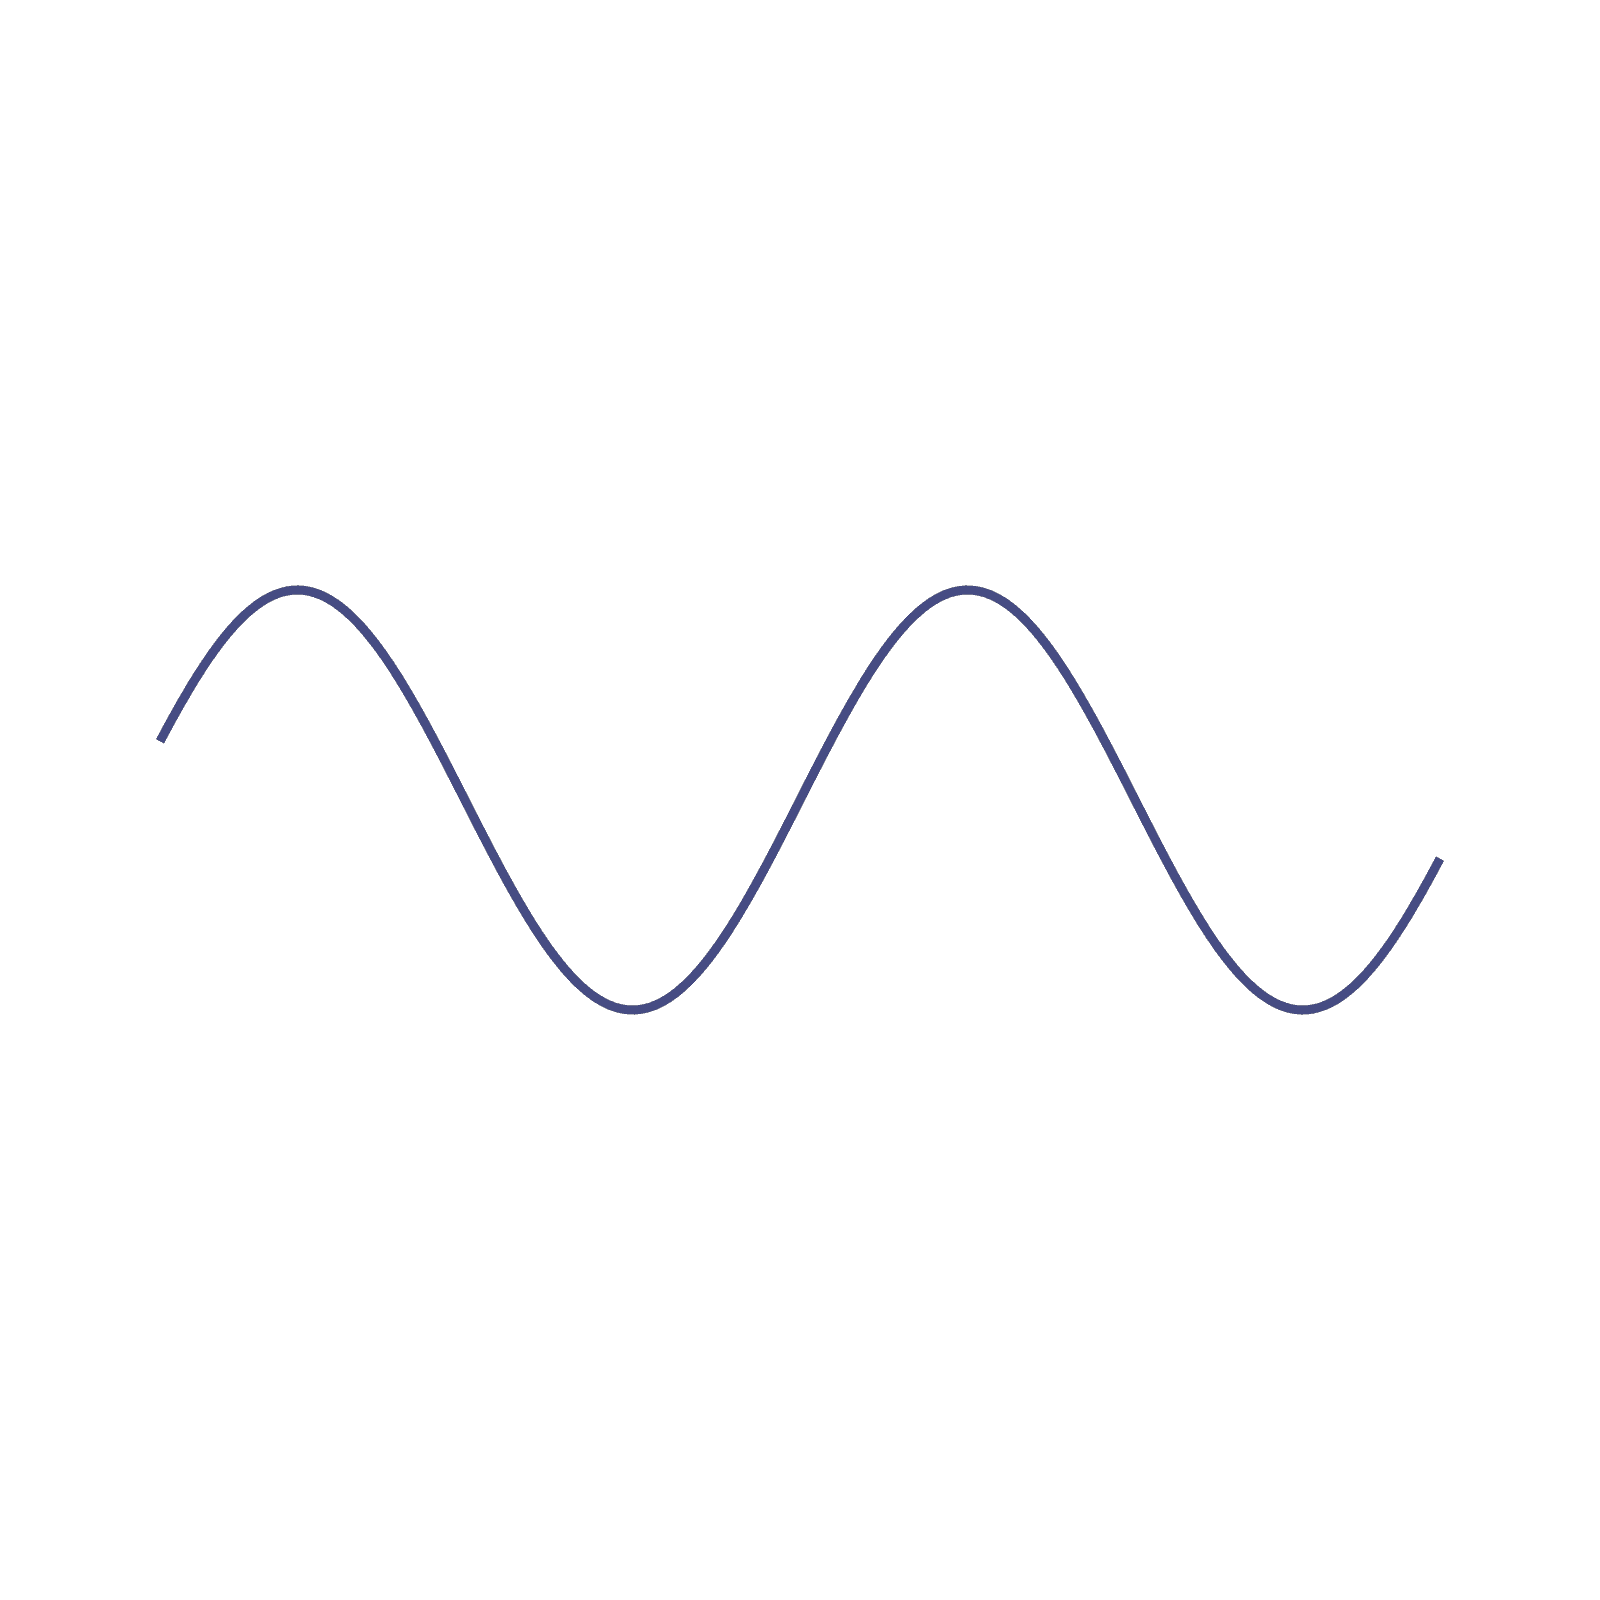
"""Function grapher: y = sin(x) drawing itself across the domain.

Render (the driver does this for every palette; these are for eyeballing):
    P=/opt/homebrew/opt/python@3.11/bin/python3.11
    ASSET_MODE=still  $P -m manim -s -t -r 1600,1600 manim/function_grapher.py FunctionGrapher
    ASSET_MODE=motion $P -m manim -qh   -r 1600,1600 manim/function_grapher.py FunctionGrapherLoop
"""

import numpy as np
from manim import (
    DOWN,
    LEFT,
    RIGHT,
    UP,
    Create,
    NumberPlane,
The full Manim source and the rendered video come with a plan.